Exploration of Severe Weather Events in Virtual Reality Environments
Lessons Learned from Interactive 3D Visualization of Meteorologic Models
Authors: M. Koutek, I. van der Neut, K. Lemcke, F. Debie, H. ter Pelkwijk, R. van Westrhenen
Date: Monday, 12 September 2011 – Thursday, 15 September 2011
Time: 09:00 – 18:00
Location: Yale 1
At KNMI, The Royal Netherlands Meteorological Institute, we work on interactive 3D (4D) visualization of meteorologic data, such as numerical weather model (NWP) data and remote sensing data. The experiences so far with the NWP models such as HIRLAM and HARMONIE are very promising. The eather3DeXplorer (W3DX) framework is a valuable tool for the NWP model developers and atmospheric researchers. Also this 3D system is being used for training of weather forecasters and at moment is implemented for use in the operational weather room. Last but not least, W3DX is an excellent weather presentation and educational tool for professionals, students and general public.
We have prepared a number of severe weather show cases that affected Europe recently, including the volcanic eruptions events where we will present volcanic ash traces, of course, in 3D.
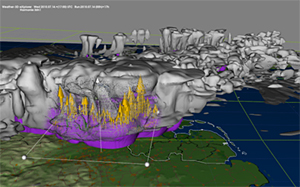
The figure shows a 3D visualization of HARMONIE weathermodel data using Weather3DeXplorer (W3DX) during a storm event over the Netherlands. 3D countours of clouds (gray) and of heavy rain areas (purple) are shown. The horizontal crossection shows the windvectors with the highest updraft winds in the area of heavy rain. Vertical axis has been scaled by a factor 10x. [Image courtesy: KNMI]
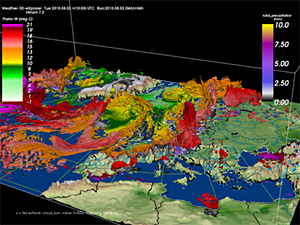
This figure shows a 3D visualization of HIRLAM weathermodel data using W3DX application with rain events in the central Europe. 3D countours of clouds are colored with the wet-bulb temperature indicating the air mass type, showing the mixing of arctic and (sub-)tropic air. The precipication is projected onto the grond surface. Vertical axis has been scaled by a factor 100x. [Image courtesy: KNMI]